Technical analysis in the stock market is like studying charts and patterns to try to predict future price movements of stocks or other financial assets. Instead of looking at a company’s fundamentals like earnings or growth potential, technical analysts focus on things like historical price data, trading volume, and other market indicators.
Imagine you’re trying to predict the weather by looking at past weather patterns, wind direction, and cloud formations. In a similar way, technical analysts look at past price movements and patterns in the market to make guesses about where prices might go next.
They use tools like charts, trend lines, and indicators (like moving averages or relative strength index) to spot trends and patterns that might indicate whether a stock is likely to go up, down, or stay the same in the future.
It’s important to remember that technical analysis isn’t foolproof and can’t predict the future with certainty. But many traders and investors use it as part of their decision-making process when buying or selling stocks.
Today we are going to discuss three major points in Technical Analysis.
- The Chart Types
There are several types of charts commonly used in technical analysis. Here are the main ones:
- Line Chart:
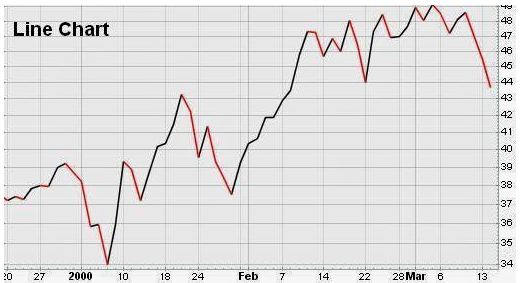
This is the simplest type of chart. It connects the closing prices of a stock over a specific time period with a line. It’s useful for showing overall trends but doesn’t provide much detail about individual price movements within that time period.
- Bar Chart:
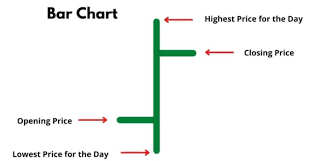
Each bar in a bar chart represents the high, low, open, and close prices of a stock for a specific time period. The top of the bar represents the highest price, the bottom represents the lowest price, and the horizontal lines on the left and right show the opening and closing prices, respectively. Bar charts provide more information than line charts and are commonly used in technical analysis.
- Candlestick Chart:
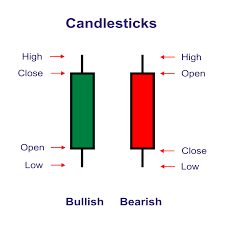
Similar to bar charts, candlestick charts also show the high, low, open, and close prices of a stock for a specific time period. However, they use candlestick-shaped bars to represent this information. The body of the candlestick (the thick part) shows the opening and closing prices, and the thin lines above and below (called shadows or wicks) show the high and low prices. Candlestick charts are popular among traders because they visually represent market sentiment and can indicate potential trend reversals.
- Heikin-Ashi Chart:
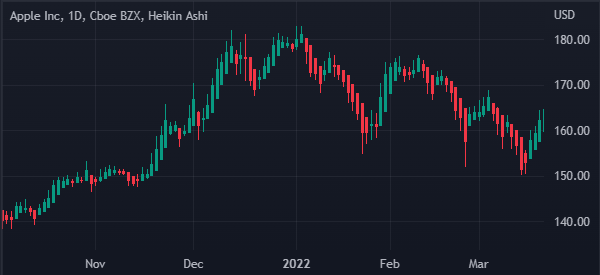
This is a type of candlestick chart that uses a modified formula to calculate the open, high, low, and close prices. Heikin-Ashi charts filter out market noise and provide a smoother representation of price trends, making it easier to identify trends and reversals.
- Renko Chart:
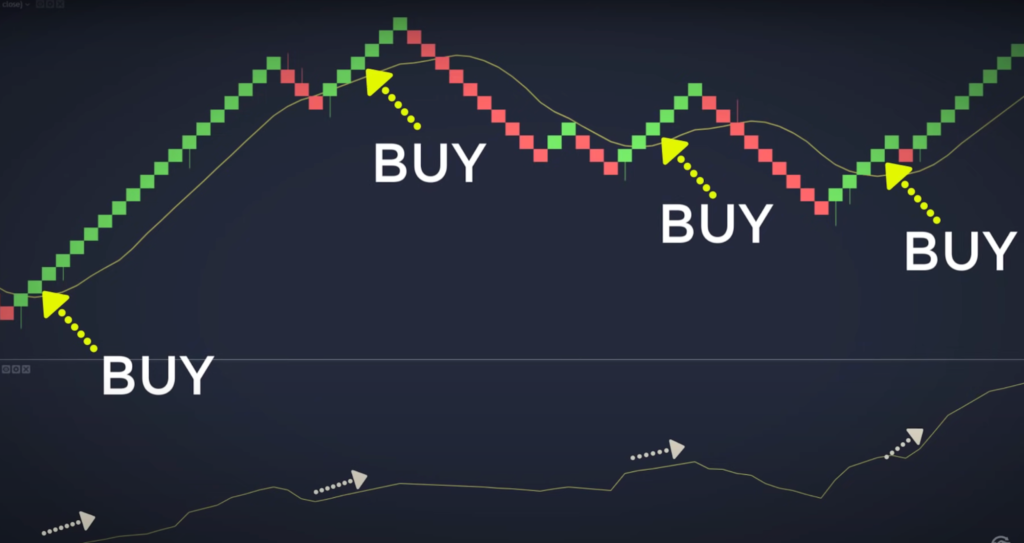
Renko charts are made up of bricks or blocks that represent price movements. Unlike traditional charts where time is the x-axis, in Renko charts, each brick is plotted only when the price moves by a predefined amount. If the price moves above the previous high, a new brick is added above the previous one, and if it moves below the previous low, a new brick is added below. Renko charts filter out noise and focus on significant price movements, helping traders identify trends more clearly.
These are some of the most commonly used chart types in technical analysis, each with its own strengths and weaknesses. Traders often choose the chart type that best suits their trading style and preferences.
- The Support and Resistance in technical analysis
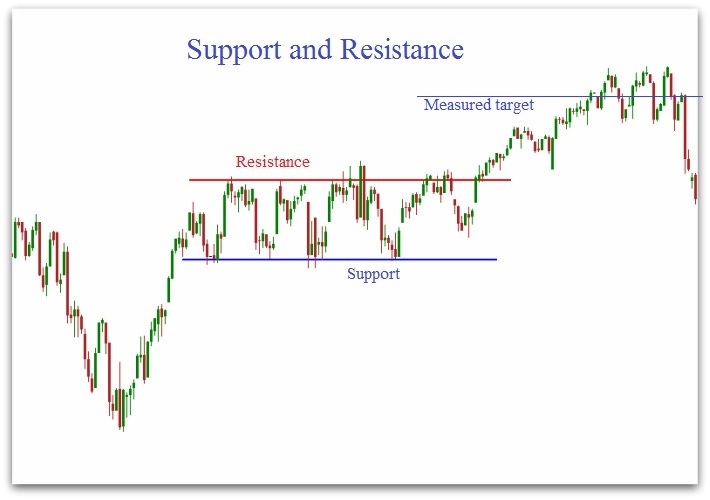
Support and resistance are key concepts in technical analysis that help traders identify levels where the price of a stock or other financial asset may pause, reverse direction, or experience increased buying or selling pressure.
- Support: Support is a price level where a stock tends to find buying interest, preventing it from falling further. It’s like a floor beneath the price, where demand for the stock increases, leading buyers to step in and prevent the price from declining further. When the price approaches a support level, traders often expect buying pressure to increase, potentially causing the price to bounce back up.
- Resistance: Resistance is the opposite of support. It’s a price level where a stock tends to face selling pressure, preventing it from rising further. It’s like a ceiling above the price, where supply of the stock increases, leading sellers to step in and prevent the price from rising beyond that level. When the price approaches a resistance level, traders often expect selling pressure to increase, potentially causing the price to reverse direction and move downwards.
Support and resistance levels are typically identified by analyzing historical price data and looking for areas where the price has repeatedly reversed direction in the past. These levels can act as psychological barriers for traders and investors. When a support or resistance level is broken, it may signal a potential trend reversal or continuation, depending on the direction of the breakout and other factors.
Traders often use support and resistance levels to make trading decisions, such as setting stop-loss orders to limit potential losses or identifying potential entry and exit points for trades. Additionally, support and resistance levels can be used in conjunction with other technical indicators to confirm trading signals and improve the accuracy of trading strategies.
- Importance of volume in technical analysis
Volume is a crucial component of technical analysis because it provides valuable insights into the strength and sustainability of price movements in the market. Here’s why volume is important:
- Confirmation of Price Movements: Volume helps confirm the validity of price movements. For example, if the price of a stock is rising and the volume is increasing as well, it suggests strong buying interest and validates the upward movement. Conversely, if the price is rising but the volume is decreasing, it may indicate weak buying interest and could signal a potential reversal.
- Identification of Trends: Volume can help identify trends in the market. During uptrends, trading volume often increases as more buyers enter the market, supporting the upward movement in prices. Similarly, during downtrends, trading volume tends to rise as more sellers participate in the market, pushing prices lower. Analyzing volume alongside price movements can help traders confirm the direction of a trend.
- Detection of Reversals: Changes in trading volume can signal potential trend reversals. For example, a sudden increase in volume after a prolonged downtrend could indicate that selling pressure is decreasing, potentially signaling a reversal to an uptrend. Conversely, a sudden increase in volume after a prolonged uptrend could signal exhaustion among buyers and the possibility of a reversal to a downtrend.
- Confirmation of Breakouts: Volume can confirm the validity of breakout patterns. Breakouts occur when the price of a stock moves above or below a significant support or resistance level. High volume during a breakout indicates strong market participation and increases the likelihood of a sustained price movement in the direction of the breakout. Conversely, low volume during a breakout suggests weak market participation and raises doubts about the sustainability of the breakout.
- Divergence Analysis: Divergence between price and volume can provide important signals about potential trend changes. For example, if the price of a stock is rising, but the volume is declining, it could indicate weakening bullish momentum and potential for a reversal. Similarly, if the price is falling, but the volume is increasing, it could suggest strengthening bearish momentum and the continuation of the downtrend.
In summary, volume is a critical aspect of technical analysis as it provides valuable insights into market dynamics, trend strength, and potential reversal points. By analyzing volume alongside price movements and other technical indicators, traders can make more informed decisions and improve the accuracy of their trading strategies.

